- Red Hat Community
- :
- DO316 - Managing Virtual Machines with Red Hat OpenShift Virtualization
- :
- Forum
- :
- Re: Welcome to the Managing Virtual Machines with ...
- Subscribe to RSS Feed
- Mark Topic as New
- Mark Topic as Read
- Float this Topic for Current User
- Bookmark
- Subscribe
- Mute
- Printer Friendly Page
- Mark as New
- Bookmark
- Subscribe
- Mute
- Subscribe to RSS Feed
- Permalink
- Report Inappropriate Content
- 19.2K Views
We are excited to launch a space dedicated to the Red Hat Training course, Managing Virtual Machines with Red Hat OpenShift Virtualization!
To gain the most value from this group - click the "Join Group" button in the upper right hand corner of the group home page.
We encourage group members to collaborate in this group to discuss topics, ask questions, share best practices and tips, provide course feedback, and share their accomplishments as it relates to DO316.
Read more about Managing Virtual Machines with Red Hat OpenShift Virtualization here.
Accepted Solutions
- Mark as New
- Bookmark
- Subscribe
- Mute
- Subscribe to RSS Feed
- Permalink
- Report Inappropriate Content
- 5,826 Views
The number of hours used on your labs can be found in a few different places:
- On your Reports page. This will have a tab for "Lab Acrtivity" and list each lab and the number oif hours used.
- On the Dashboard. This will have a list of all labs that were created, and how many hours spent on each
- From a downloaded report. From either link above, there will be an option to download a TSV report. This report will list the courses where the labs were created, and include the number of hours used.
Please note, that depending on your subscription type, you access to each of the above may be limited.
- Mark as New
- Bookmark
- Subscribe
- Mute
- Subscribe to RSS Feed
- Permalink
- Report Inappropriate Content
- 7,963 Views
- Mark as New
- Bookmark
- Subscribe
- Mute
- Subscribe to RSS Feed
- Permalink
- Report Inappropriate Content
- 7,961 Views
Hello @ikkeT !
Thanks for reaching out !
Where exactly are you facing this issue in DO316 course ? Please help me with some more details, eg.- a screenshot, chapter and section details , lab name etc. so that we can check this out for you.
- Mark as New
- Bookmark
- Subscribe
- Mute
- Subscribe to RSS Feed
- Permalink
- Report Inappropriate Content
- 7,961 Views
ah, I thought you get the location, as the chat was at the course page. Here is the direct link, it's the chapter about monitoring query:
https://role.rhu.redhat.com/rol-rhu/app/courses/do316-4.10/pages/ch02s06
The namespace options here break it, if you take away the namespace filter, it works.
- Mark as New
- Bookmark
- Subscribe
- Mute
- Subscribe to RSS Feed
- Permalink
- Report Inappropriate Content
- 6,783 Views
@ikkeT Sure let me take a look !
- Mark as New
- Bookmark
- Subscribe
- Mute
- Subscribe to RSS Feed
- Permalink
- Report Inappropriate Content
- 6,770 Views
- Mark as New
- Bookmark
- Subscribe
- Mute
- Subscribe to RSS Feed
- Permalink
- Report Inappropriate Content
- 6,637 Views
You are not doing what the instructions say. Instructions have this part there:
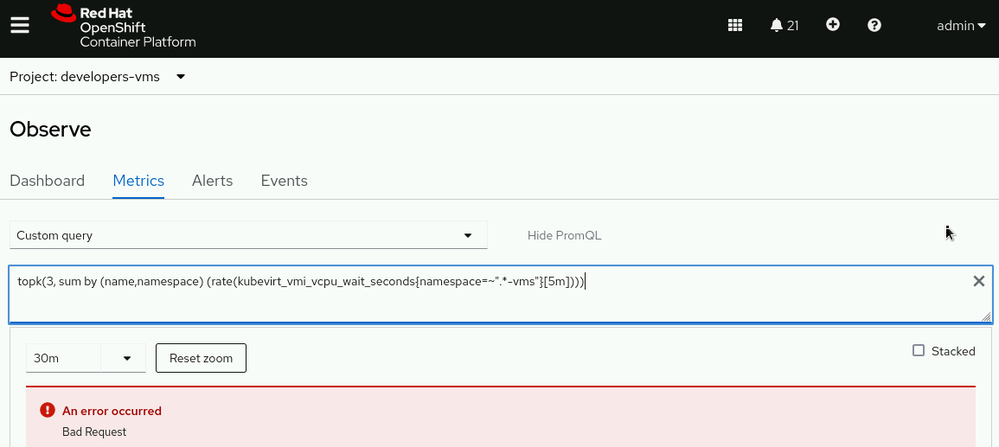
{namespace=~".*-vms"}It works for me also without them, but if you copy paste the instructions as guided, it won't work.
- Mark as New
- Bookmark
- Subscribe
- Mute
- Subscribe to RSS Feed
- Permalink
- Report Inappropriate Content
- 6,635 Views
Ok @ikkeT Let me check that and I will get back to you.
- Mark as New
- Bookmark
- Subscribe
- Mute
- Subscribe to RSS Feed
- Permalink
- Report Inappropriate Content
- 6,627 Views
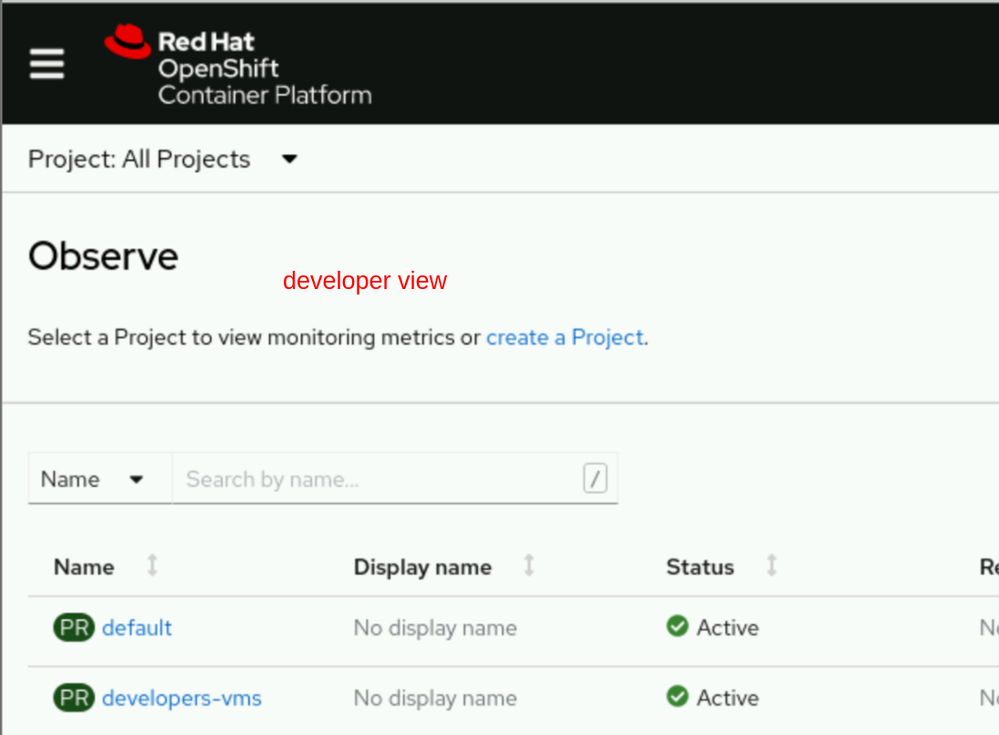
For some reason, if you go through adminstrator view to observe it works, but if you go via developer view to observe, it won't work. Some bug with OCP perhaps?
- Mark as New
- Bookmark
- Subscribe
- Mute
- Subscribe to RSS Feed
- Permalink
- Report Inappropriate Content
- 6,616 Views
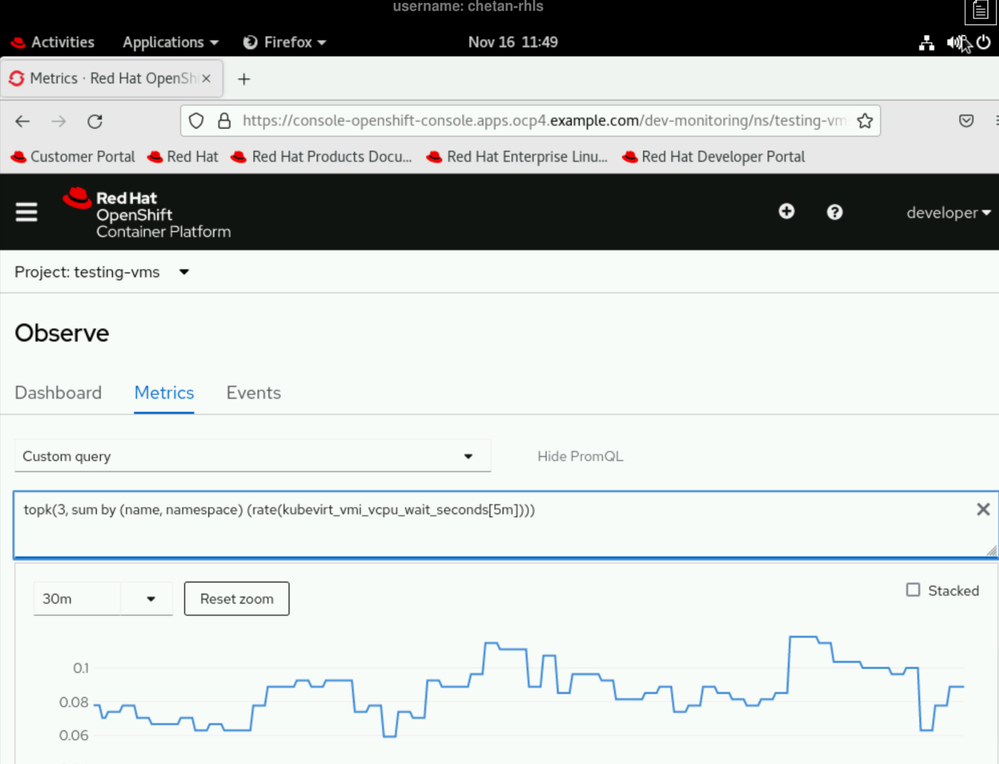
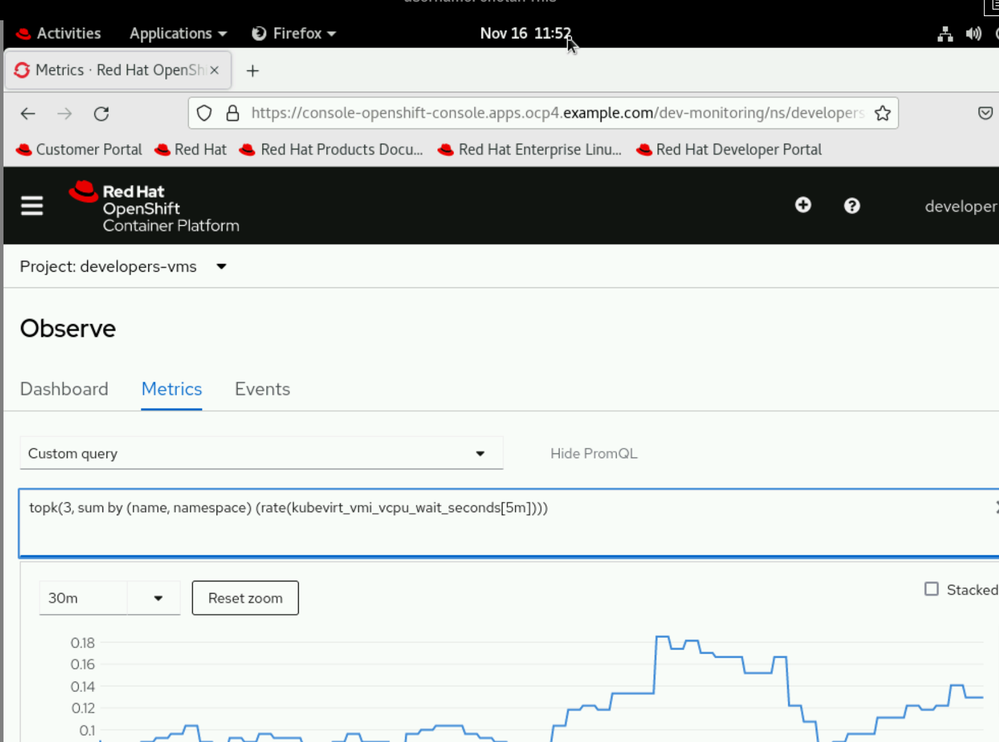
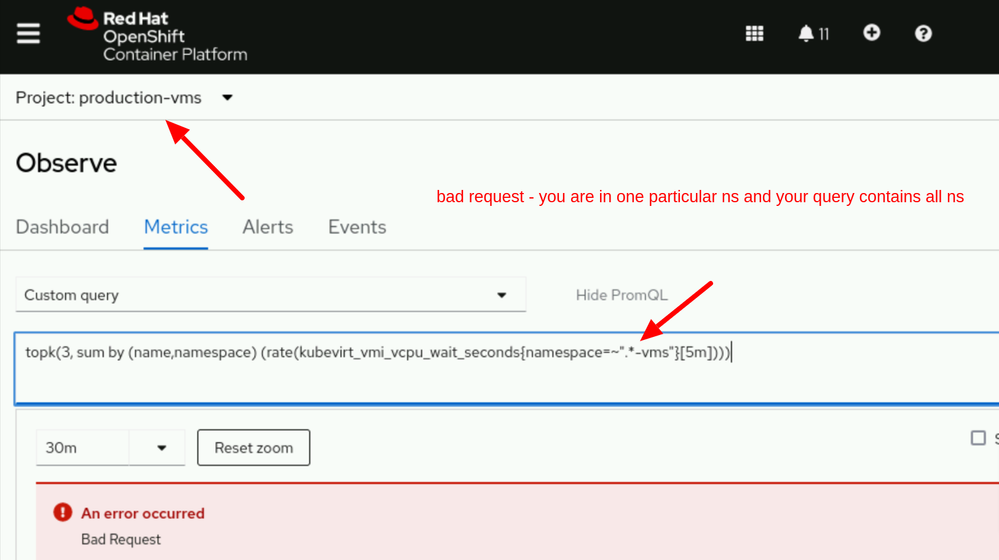
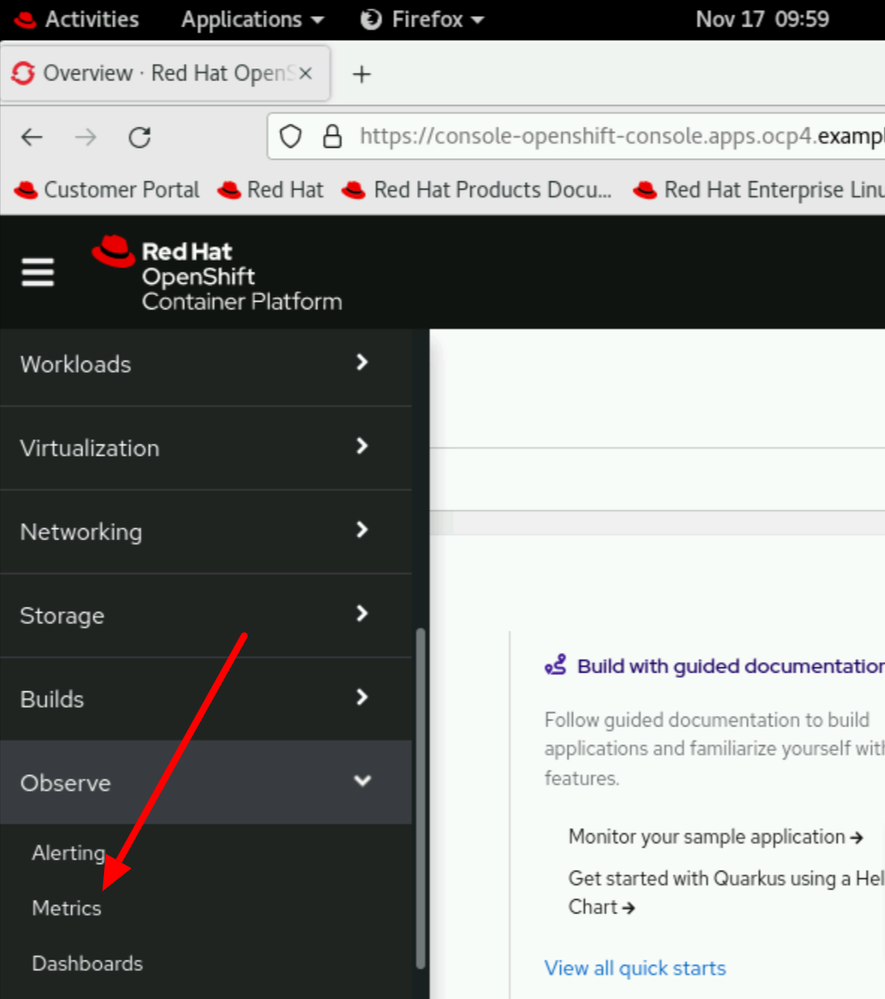
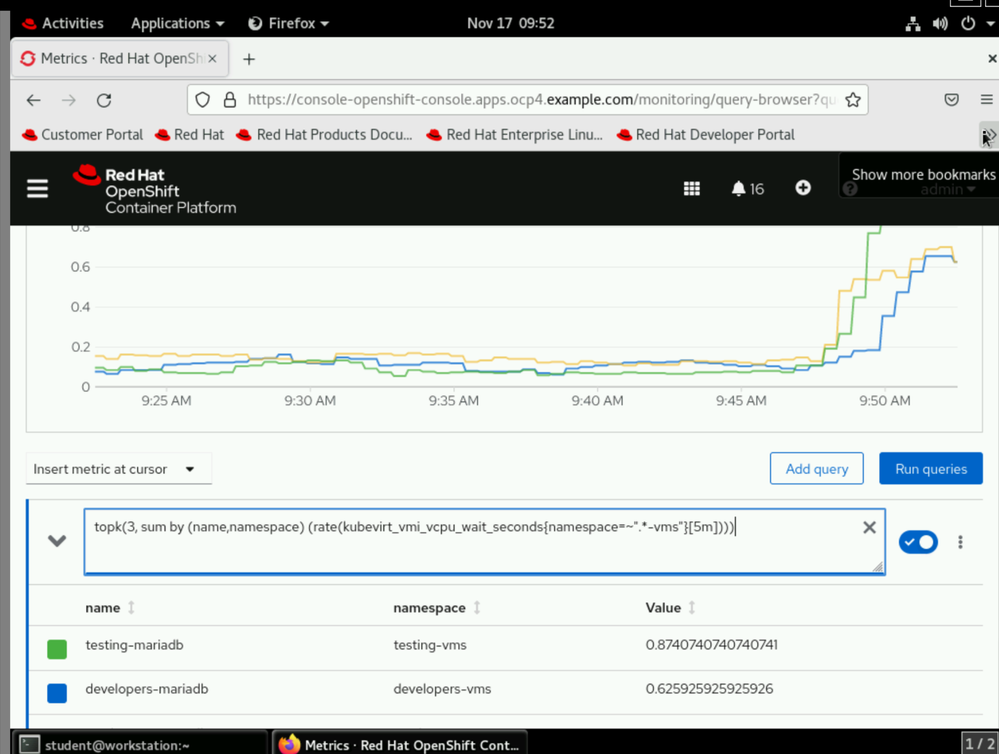
@ikkeT The course at step 6 tells you to login as admin and then go to observe --> metrics option. This option is not present in developer view hence the query wont work for all projects.
In developers view you can have the graph for individual projects
hence the bad request when you run query with * vms in all projects :
whereas in administrator view you have the Observe --> metrics option :
and it is for all namespaces not for a particular namespaces :
Also refer ch02s05 wherein the course mentions this :
"Only cluster administrators have access to all namespaces concurrently in the Observe → Metrics interface.
From the Developer perspective, you can navigate to Observe and then click the Dashboard tab to review various metrics, including CPU and memory usage charts, current network usage, bandwidth, and storage I/O for individual projects."
so, I dont think this is a bug but by design.
Red Hat
Learning Community
A collaborative learning environment, enabling open source skill development.
