- Red Hat Community
- :
- Discuss
- :
- General
- :
- Re: how to find process memory usage from RAM in l...
- Subscribe to RSS Feed
- Mark Topic as New
- Mark Topic as Read
- Float this Topic for Current User
- Bookmark
- Subscribe
- Mute
- Printer Friendly Page
- Mark as New
- Bookmark
- Subscribe
- Mute
- Subscribe to RSS Feed
- Permalink
- Report Inappropriate Content
- 27.6K Views
Hello All,
Please find my questions and proivde me your valuable suggestions/help/guidance .
if any difference like dependency like OS version for execute command then please specify the command . its for me learning and some doubts that reason posting here . I hope you understand about my intensions.
OS : Linux OS (RHEL/CentOS)
Question 1:
How to know , which process consuming memeory in the RAM in Linux OS.
How much using and available .
example:
in my Linux OS box :
up and running tomcat and apache web servers .
how to find out tomcat/java processor consuming the RAM .
How to calculate each process if running memory details in RAM .
Please check and provide detailed information .
I am waiting for your valuable reply .
Question 2:
I tried to use top command memory usage details with Gb using E option able to see but same OS other box'es unable to see .
how to read top command memeory in human readable format , if any command is there then please share to check .
please find one sample:
top - 14:14:36 up 1:09, 3 users, load average: 0.00, 0.04, 0.06
Tasks: 356 total, 1 running, 355 sleeping, 0 stopped, 0 zombie
%Cpu(s): 0.0 us, 6.7 sy, 0.0 ni, 93.3 id, 0.0 wa, 0.0 hi, 0.0 si, 0.0 st
MiB Mem : 3887.4 total, 1065.9 free, 2073.4 used, 1051.6 buff/cache
MiB Swap: 10240.0 total, 10240.0 free, 0.0 used. 1814.0 avail Mem
===========
I entered top command then get above mentioned output .
actually my question is how to get human readable format of "MiB" information on top command details .
Please check and provide if any command on terminal get output directly like "free -h" for top command .
if its there then please share the command . if no command like "free -h" command for top then please ignore this question.
Thanks and Regards,
Jeesshansree
Accepted Solutions
- Mark as New
- Bookmark
- Subscribe
- Mute
- Subscribe to RSS Feed
- Permalink
- Report Inappropriate Content
- 27.6K Views
Hello @jeesshnasree !
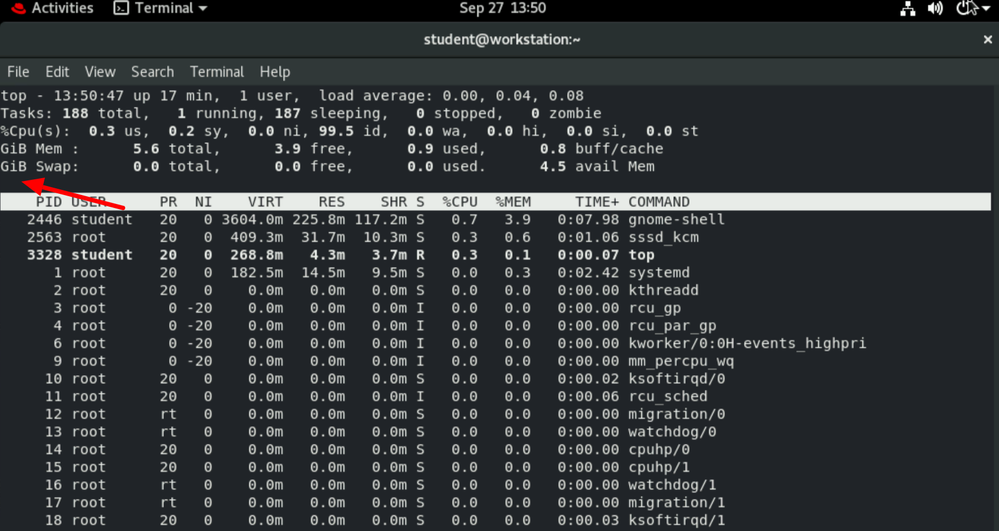
Memory statistics in MiB is also human readable. If you specifically want top to give you that statistics in GiB then do :
#top
then press shift+e
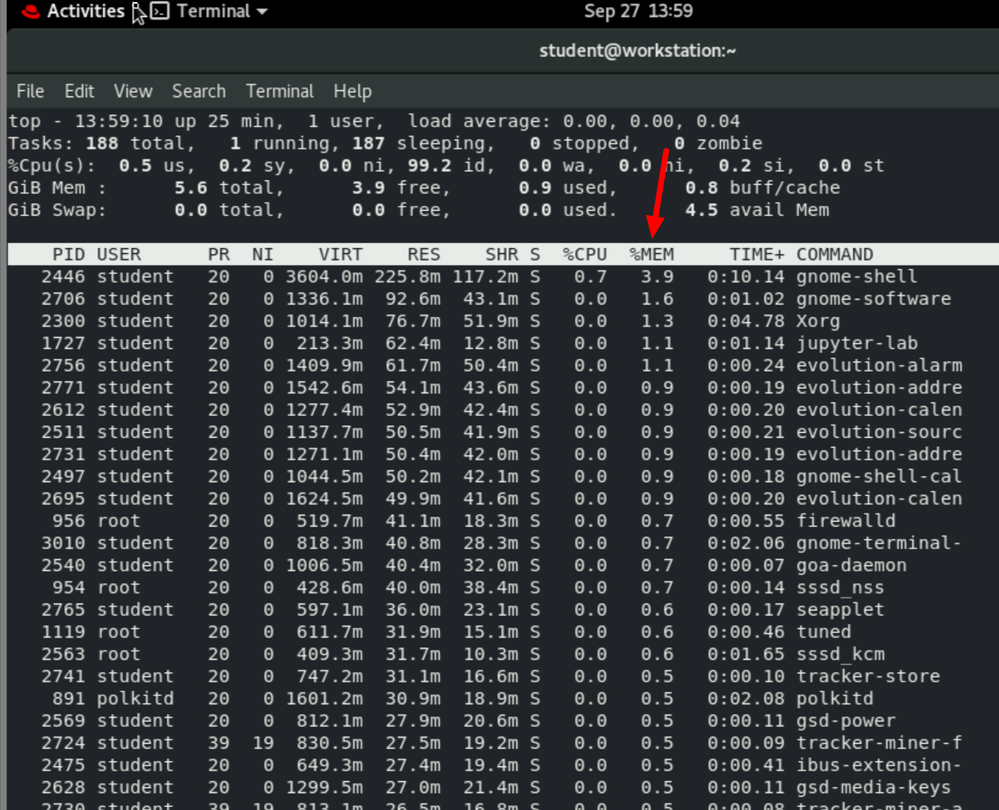
To sort the top output by memory utilisation : press M :
For getting info of processes consuming the RAM , check these fields in top :
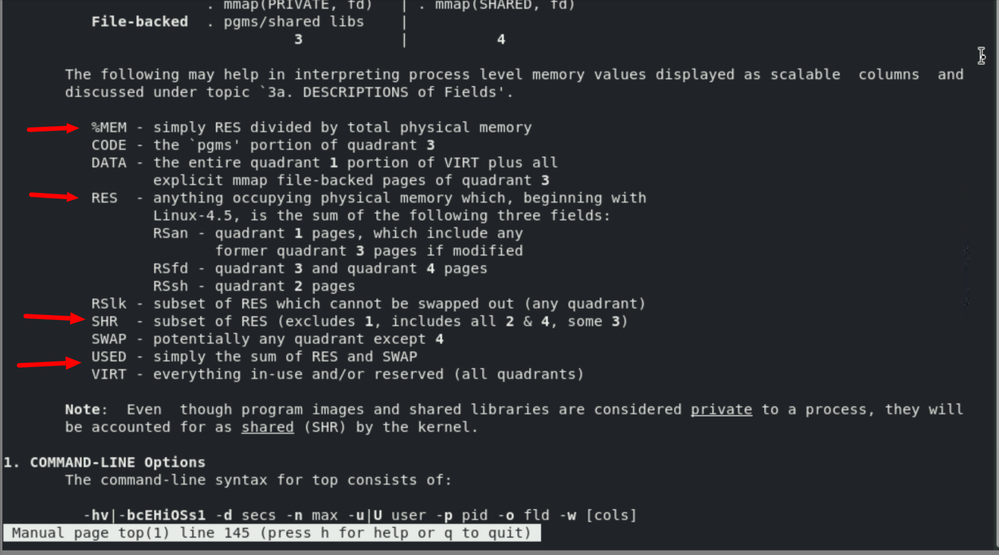
Refer man page of top for the definition of these values :
%MEM: The percentage of the physical memory the process is using.
VIRT: This is the Virtual Memory Size of the process. Virtual memory is the total physical and swap memory used by the process.
RES: This is the Resident Memory Size of the process. The resident memory is the amount of physical memory the process is using.
SHR: This is the Shared Memory Size of the process. This is the amount of memory that the process is using that is also shared with some other processes.
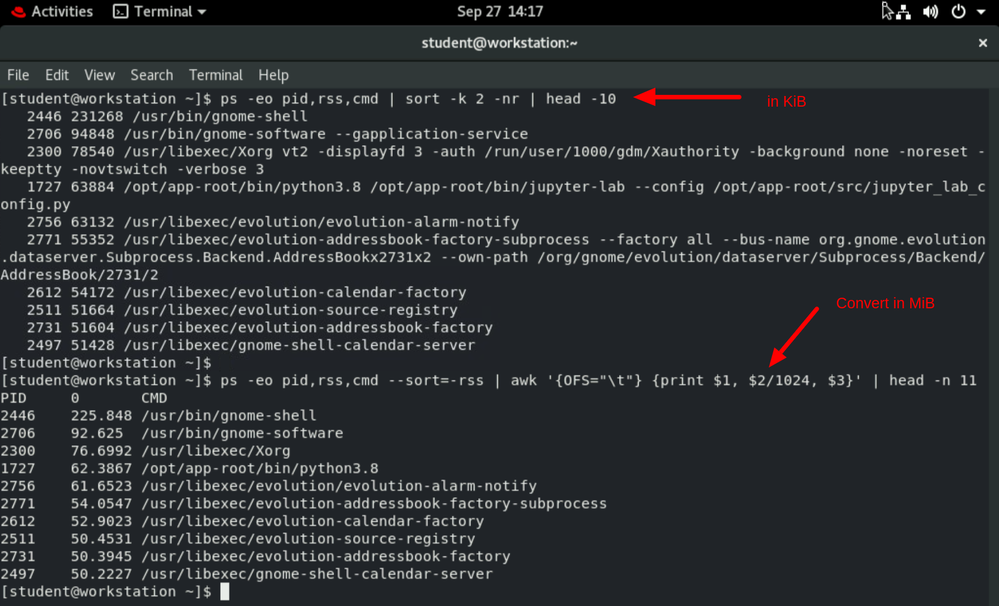
Use CLI tool - ps to get the same memory utilisation :
This is a general overview and should not be a 100% accurate measurement of RAM usage , eg. RSS value doesn’t take into account libraries already loaded in memory.
- Mark as New
- Bookmark
- Subscribe
- Mute
- Subscribe to RSS Feed
- Permalink
- Report Inappropriate Content
- 27.5K Views
Hello @Chetan_Tiwary_ ,
Shift +e is working some systems & some hostnames its working .
Please check & provide : one line command on terminal for Top command memory human readable format like Mega/Giga . if possiible please share command . I hope clearly explain about my doubt . thank you for share the details .
Thanks and Regards,
Jeesshansree
- Mark as New
- Bookmark
- Subscribe
- Mute
- Subscribe to RSS Feed
- Permalink
- Report Inappropriate Content
- 27.4K Views
Hi @jeesshnasree,
Try out htop command, it's an improved version of the top command with much user-friendliness and mouse interactive.
- Mark as New
- Bookmark
- Subscribe
- Mute
- Subscribe to RSS Feed
- Permalink
- Report Inappropriate Content
- 26.9K Views
- Mark as New
- Bookmark
- Subscribe
- Mute
- Subscribe to RSS Feed
- Permalink
- Report Inappropriate Content
- 26.9K Views
Hello @Chetan_Tiwary_ ,
Please check below screenshot & provide guidance ( reason is free memeory 0) .
Mentioned example screenshot : In the machine some process are running then free memory is 0 buff/cache utilization is more .
How to troubleshoot this issue . Please provide me if any guidance .
Any suggestions about below mentioned example :
Thanks and Regards,
Jeesshansree
- Mark as New
- Bookmark
- Subscribe
- Mute
- Subscribe to RSS Feed
- Permalink
- Report Inappropriate Content
- 26.9K Views
- Mark as New
- Bookmark
- Subscribe
- Mute
- Subscribe to RSS Feed
- Permalink
- Report Inappropriate Content
- 27.4K Views
The ps command can be used to display information about processes that use the most memory resources. Compared with top, which gives a dynamic real-time view of system resources, ps reports a snapshot of the currently running processes.
$ ps -eo pid,user,s,comm,size,vsize,rss --sort -size | head
  PID USER     S COMMAND          SIZE    VSZ   RSS
 3059 mysql    S mysqld          330000 343552 172724
 2041 root     S nessusd         326112 333348 114108
 2297 bind     S named           42920  52976  1440
11763 www-data S apache2         26324 108256 27168
 2067 root     S rsyslogd        25452  28208  1092
 3547 www-data S zmfilter.pl     18900  29360  2348
11770 www-data S apache2         16676  98608 18132
11769 www-data S apache2         16380  98312 12880
11768 www-data S apache2         16128  98060 13284
Parameters used are as follows:
- -e: select all processes.
- -o: specify user-defined format.
- pid: process ID.
- user: user name.
- s: minimal state display (one character).
- S for sleeping (idle).
- R for running.
- D for disk sleep (uninterruptible).
- Z for zombie (waiting for parent to read it’s exit status).
- T for traced or suspended (e.g by SIGTSTP).
- W for paging.
- comm: command name (only the executable name).
- size: memory size in kilobytes.
- vsize: total VM size in kilobytes.
- rss: resident set size, the non-swapped physical memory that a task has used .
- –sort -size: sort size in descending numerical order.
- Mark as New
- Bookmark
- Subscribe
- Mute
- Subscribe to RSS Feed
- Permalink
- Report Inappropriate Content
- 26.9K Views
Red Hat
Learning Community
A collaborative learning environment, enabling open source skill development.


